This one is an old school project, but one that still makes me proud. The actual problem is very simple: Tarzan, the Lord of the Jungle, always traverses the regions of the forest he lives with ease, by jumping from one tree to another. But last night, a great storm took down some of the trees. Will tarzan be able to go from one region to another with the remaining trees?
If you wanna check the code, go to this GitHub Link
The C part
I can’t recall much from the time I made this code, nor I can assure I fully remember how it works. But I had to do some tweaks and updates, like adding a for loop to populate the graph as the initial state of the forest and a random lightning simulator to act as the storm, since all those tasks were made manually before.
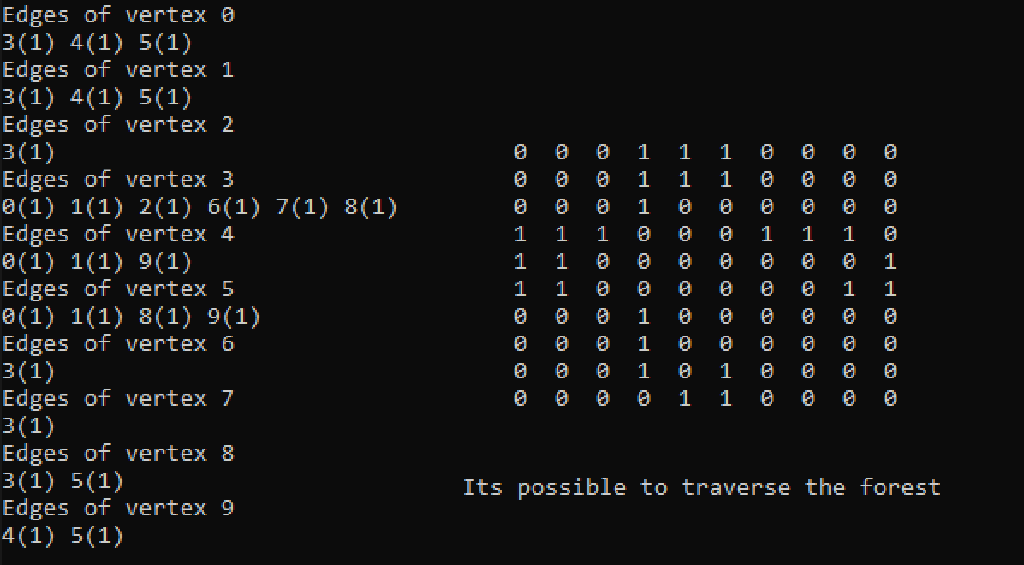
First we generate a graph to populate. This is made by a function called create_graph( ) that takes the pointer address from the graph struct created in tarzan.h, and the size of the desired graph as arguments to create a square-zero matrix. The size of the matrix will determine the number of regions in Tarzan’s Forest. After that, we populate the matrix’s graph as said early with a loop and the add_edge( ) function. If the position m[i][j] is populated with 1, it means that there’s a tree there, thus creating a path between region i and region j.
So, in that logic, the vertices of the graph are the regions and the edges are the trees uniting those regions.
To ensure that the code is running as we want, we print the edges of the vertices and the matrix.
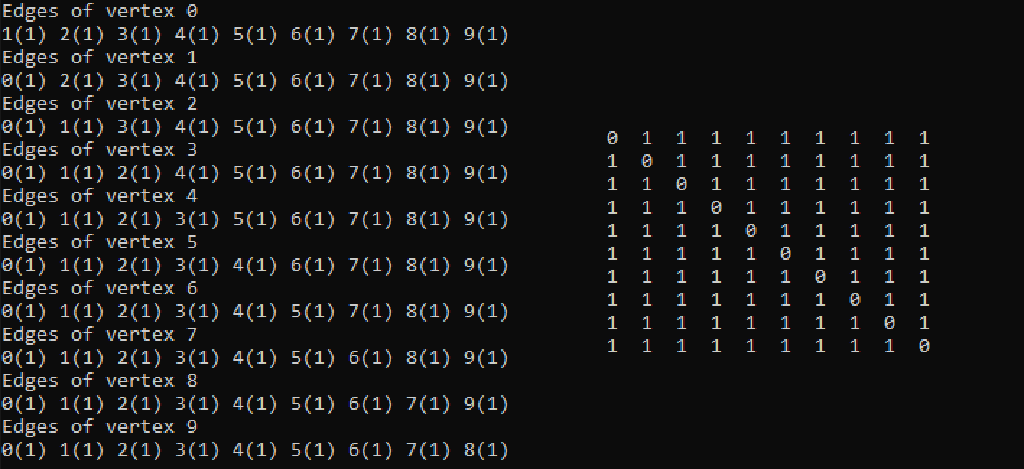
After verifying that the initial matrix was sucessfully generated, we then proceed to simulate the storm.
Here’s a snippet of the storm simulation code:
Storm Simulation
|
|
The code is actually very simple. Just some for loops that run through the matrix storing the graph data, a random number generator, and an if that checks if the number is even or odd. If its even, then the lightning strucks the tree in the position m[i][j] (and m[j][i], since its a two way path), therefore changing the cell m[i][j] value from 1 to 0.
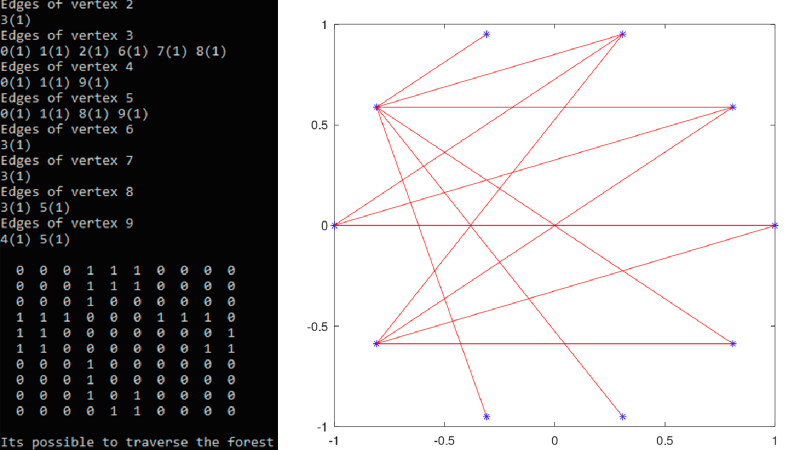
After that, the output is printed, and the paths are evaluated by the function search_path( ). If all nodes are connected, then Tarzan can traverse all regions.
But, to allow graphical representations, we must store our gathered data somewhere. Right?
That’s where the function generate_file( ) comes in handy. First, the function creates a file named graph.txt, if it wasn’t created already. After that, we write all the cells of our graph’s matrix on the txt file. And here’s our code:
Exporting the data into a file
|
|
The Matlab part
Well, you can say that I’m a sucker for graphics. Of course, who doesn’t love expending numerous hours behind a computer screen just to create a single image?
But I must give credit where credit is due. Programming in Matlab ain’t easy if you’re not into mathematics. And that’s the sole reason why I find so satisfying when those crazy little lines show up on the screen.
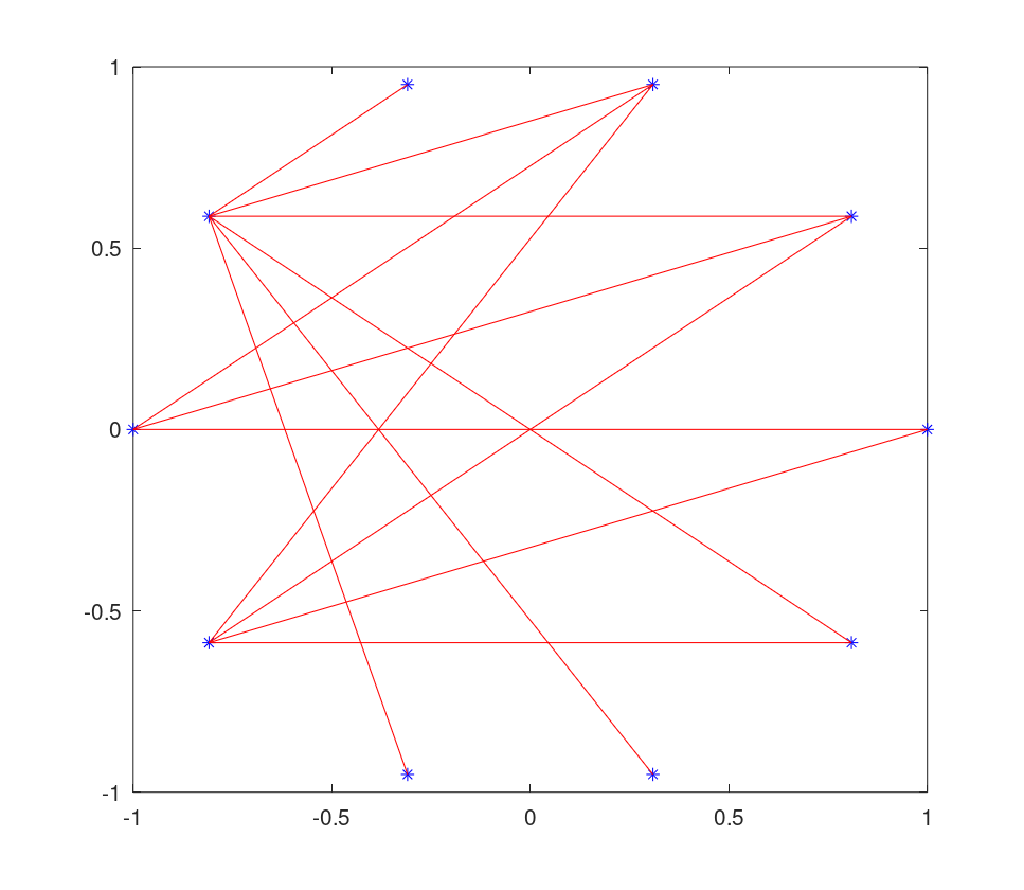
Still, we need numbers to form our crazy little lines. Luckly, we have our graph.txt file to help. The first thing we need to do is import our file and convert it into a new matrix. Then, we must find a way to transform the columns (or lines) of this matrix into our nodes. For a better visual representation, the nodes will be placed in a radius of 1 unity from the center of the graphic, and equidistant from adjacent nodes (just like in a regular polygon). This is possible by this simple equation in this for loop:
|
|
After that, it’s just a matter of connecting dots and erasing lines. The code is available on GitHub, in case you want to see how the plot of the lines and the rest of the graph is done. By plotting our graph, we can visualize our initial output and see if it is really impossible to traverse Tarzan’s Forest.